MapInfo Crime Profiler
Analyse crime data to help protect against theft, fraud and more
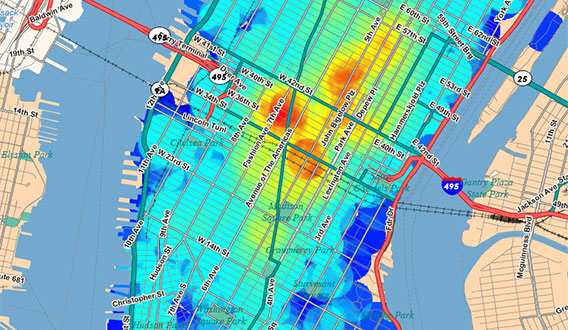
MapInfo Crime Profiler gives law enforcement and public safety agencies the crime data analysis they need to maximise their resources. This powerful information helps detectives predict crime patterns, link crimes to specific criminals, identify and apprehend suspects and realise a lower overall crime rate.
Hot spot analysis, interactive analytical investigation and temporal analysis are key features of MapInfo Crime Profiler. This powerful crime data solution also includes highly visual and interactive charting and graphing capabilities such as sophisticated time-based analysis.
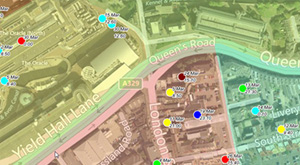
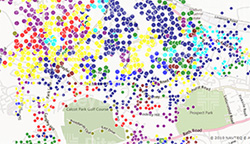
Easy-to-use, interactive hot spot map creation
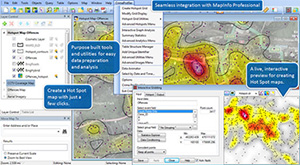 MapInfo Crime Profiler gives you the ability to work with and represent subsets of specific crime data by series, type, time, locale or other characteristics. Create interactive maps that allow you to instantly see how different spatial and temporal settings change the representation of your data. This lets you discover hidden patterns and spot trends and relationships so you can take fast action to stop crimes before they happen. MapInfo Crime Profiler gives you the ability to work with and represent subsets of specific crime data by series, type, time, locale or other characteristics. Create interactive maps that allow you to instantly see how different spatial and temporal settings change the representation of your data. This lets you discover hidden patterns and spot trends and relationships so you can take fast action to stop crimes before they happen.
|
Link maps, charts and graphs in real-time
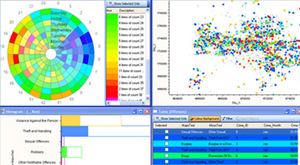 With the use of combined maps, charts and graphs you can display linked data in different views. This scenario generation capability allows you to perform real-time “what if” analysis on your data, then share it in a variety of digital formats and printouts to your team and beyond. With the use of combined maps, charts and graphs you can display linked data in different views. This scenario generation capability allows you to perform real-time “what if” analysis on your data, then share it in a variety of digital formats and printouts to your team and beyond.
|
Create maps in a variety of formats
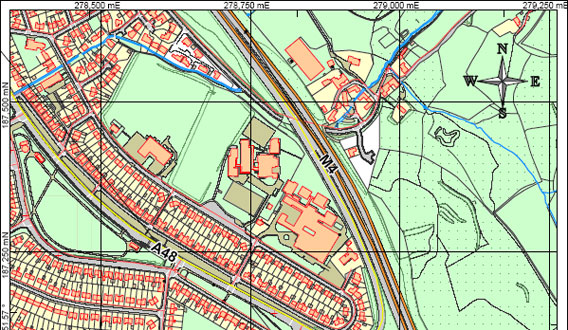
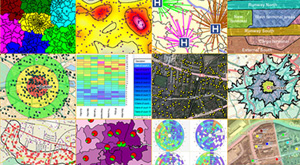 With MapInfo Crime Profiler you can deliver mapping capabilities in a wide range of formats and types; aerial photography, street maps, demographics, segmentation maps and more. If you receive data in different formats from various internal or external sources, Crime Profiler consolidates it and brings it to life. With MapInfo Crime Profiler you can deliver mapping capabilities in a wide range of formats and types; aerial photography, street maps, demographics, segmentation maps and more. If you receive data in different formats from various internal or external sources, Crime Profiler consolidates it and brings it to life.
|
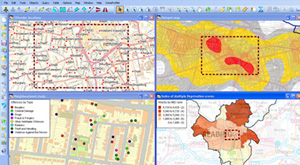
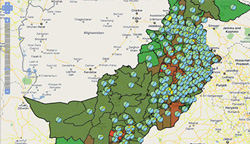
Define Police Force boundaries
 MapInfo Crime Profiler can help you to define the most effective police force boundaries, such as beats and patrol areas. This can be done in a number of ways and can incorporate crime data, statistical data or other mission-critical factors. MapInfo Crime Profiler can help you to define the most effective police force boundaries, such as beats and patrol areas. This can be done in a number of ways and can incorporate crime data, statistical data or other mission-critical factors.
|
From tactical to strategic
 Crime Profiler is suitable for all forms of visualisation and analysis. This can range from the tactical planning of local initiatives such as an investigation into a particular incident or offender, a targeted crime prevention campaign in a particular area or even for high level force wide strategic planning. Crime Profiler is suitable for all forms of visualisation and analysis. This can range from the tactical planning of local initiatives such as an investigation into a particular incident or offender, a targeted crime prevention campaign in a particular area or even for high level force wide strategic planning.
|
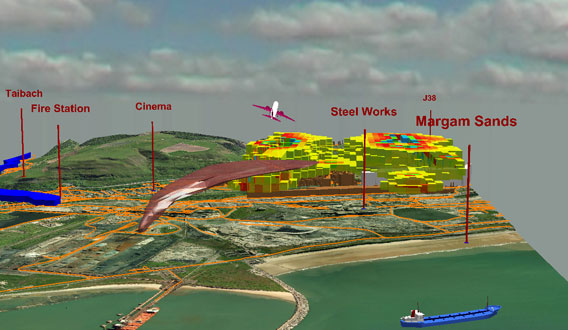
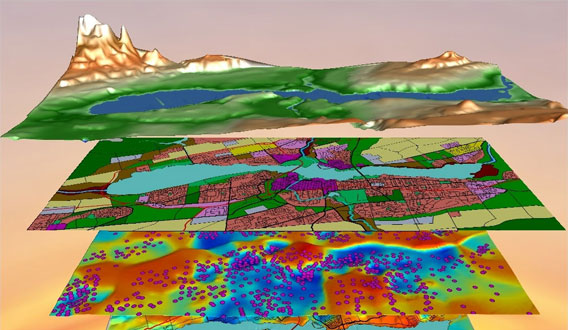
MapInfo Engage and Engage3D
Leverage powerful analytical and 3D visualisation capabilities for advanced problem solving.
From stream-lined map production to powerful 2D and 3D analytical tools, the Engage suite turbo-charges the MapInfo® Pro GIS environment with an extensive range of capabilities.
Model spatial information such as terrain or demographic data as interpolated surfaces with Engage3D, allowing powerful trend identification, analysis and refinement. Or visualise and model your datasets in true real-time 3D with Engage3D Pro, and create effective and informative fly-through movies for powerful presentations.
Map making
 Professional map production is a breeze with Engage’s Scaled Output wizard. Automatically create correctly scaled and sized layouts for your desired page size, with titleblocks, scalebars and map grids. Use the new EngageBatchPrinting module to create a series of map sheet boundaries over a region and automatically batch print an entire map series onto pre-defined templates. Items such as map name, map number, date, scale, etc. are automatically updated on each map. Location indexes can be automatically generated to assist with generation of map books such as street directories. Dynamically create perfectly-sized text labels at a specified output scale with the new label creator functionality. Professional map production is a breeze with Engage’s Scaled Output wizard. Automatically create correctly scaled and sized layouts for your desired page size, with titleblocks, scalebars and map grids. Use the new EngageBatchPrinting module to create a series of map sheet boundaries over a region and automatically batch print an entire map series onto pre-defined templates. Items such as map name, map number, date, scale, etc. are automatically updated on each map. Location indexes can be automatically generated to assist with generation of map books such as street directories. Dynamically create perfectly-sized text labels at a specified output scale with the new label creator functionality.
|
Advanced analysis
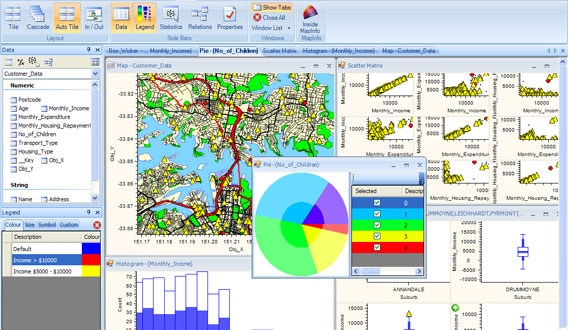 A detailed analysis and understanding of all aspects of your datasets, such as demographic, sales or incident information, can add significant value to the resulting interpretations and modelling. The Engage application provides an extensive array of advanced analytical functionality at your fingertips, allowing varied datasets to be assessed dynamically in statistical, spatial, temporal and graphical views. A detailed analysis and understanding of all aspects of your datasets, such as demographic, sales or incident information, can add significant value to the resulting interpretations and modelling. The Engage application provides an extensive array of advanced analytical functionality at your fingertips, allowing varied datasets to be assessed dynamically in statistical, spatial, temporal and graphical views.
|
Gridded surface interpolation and manipulation
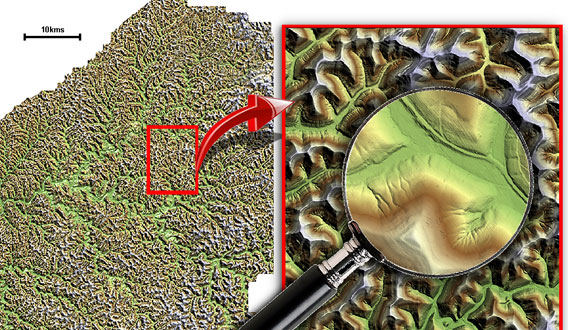 Engage3D provides a comprehensive set of surface gridding tools for interactively interpolating point, line and polygon data, such as demographics, sales, meteorological, topographic, chemical and environmental surveys. A broad range of gridding methods are readily available, such as Kriging, Density, Inverse Distance Weighting and Minimum Curvature algorithms. The resulting grids can easily be contoured, queried and modified with a versatile collection of transformation tools. This allows you to compute curvature, slope, aspect, volumes, and other surface properties, or use the versatile grid calculator to derive values from user-defined expressions. Engage3D provides a comprehensive set of surface gridding tools for interactively interpolating point, line and polygon data, such as demographics, sales, meteorological, topographic, chemical and environmental surveys. A broad range of gridding methods are readily available, such as Kriging, Density, Inverse Distance Weighting and Minimum Curvature algorithms. The resulting grids can easily be contoured, queried and modified with a versatile collection of transformation tools. This allows you to compute curvature, slope, aspect, volumes, and other surface properties, or use the versatile grid calculator to derive values from user-defined expressions.
|
A unified 3D environment
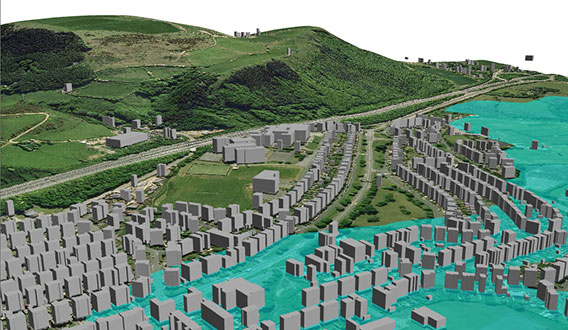 The powerful Engage3D Pro application allows you to combine, visualise, interrogate, and model your data in a dynamic and immersive 3D environment. Buildings and infrastructure, client and sample locations, photogrammetry, interpretations, surface models, solids models, and voxel models can all be viewed in the same 3D space. So when modelling and interpreting in 3D, you can be sure your interpretations are fully informed and precise – in every dimension. The powerful Engage3D Pro application allows you to combine, visualise, interrogate, and model your data in a dynamic and immersive 3D environment. Buildings and infrastructure, client and sample locations, photogrammetry, interpretations, surface models, solids models, and voxel models can all be viewed in the same 3D space. So when modelling and interpreting in 3D, you can be sure your interpretations are fully informed and precise – in every dimension.
|
Produce exciting 3D presentations
 Complex Engage3D Pro sessions can be viewed by any Engage3D user with the included 3D viewer. Create professional movies (in standard video formats) with dynamic data content throughout; perfect for eye-catching shareholder, public-relations and conference presentations Complex Engage3D Pro sessions can be viewed by any Engage3D user with the included 3D viewer. Create professional movies (in standard video formats) with dynamic data content throughout; perfect for eye-catching shareholder, public-relations and conference presentations
|
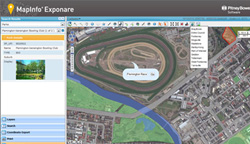
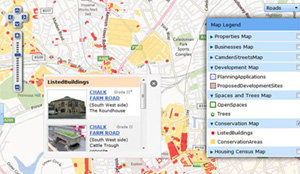
MapInfo Exponare
Make corporate data more meaningful for better analysis and decision making
Exponare is the ultimate information portal making corporate data more meaningful for better analysis and improved decision making.
Easy to Use
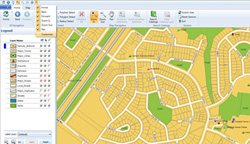 MapInfo Exponare has been designed with usability in mind so that all users, regardless of their skills or experience, can access the information they need in a timely manner. Intuitive user interface concepts have been deployed, including a Microsoft Office-like ribbon toolbar to improve ease of use and learning, and a Quick Access Toolbar so users can set up shortcuts to their most commonly used tools. Different interfaces are available for internal, external and mobile users. MapInfo Exponare has been designed with usability in mind so that all users, regardless of their skills or experience, can access the information they need in a timely manner. Intuitive user interface concepts have been deployed, including a Microsoft Office-like ribbon toolbar to improve ease of use and learning, and a Quick Access Toolbar so users can set up shortcuts to their most commonly used tools. Different interfaces are available for internal, external and mobile users.
|
Simple to administer
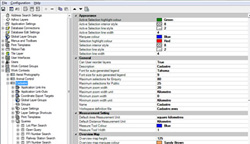 The intuitive Configuration Manager gives administrators the flexibility they need without the need to write code. Administrators can configure user profiles to determine the functionality, data sets, queries, views, print templates and application links that each user or group of users can access. Windows Active Directory is supported, making it easier for users to login. MapInfo Exponare can be administered by a single administrator or group of administrators, all saving their changes simultaneously. The intuitive Configuration Manager gives administrators the flexibility they need without the need to write code. Administrators can configure user profiles to determine the functionality, data sets, queries, views, print templates and application links that each user or group of users can access. Windows Active Directory is supported, making it easier for users to login. MapInfo Exponare can be administered by a single administrator or group of administrators, all saving their changes simultaneously.
|
Information portal
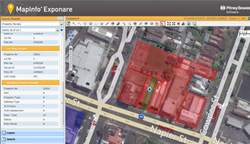 MapInfo Exponare provides a map-based portal into an organisation’s data, both spatial and non-spatial. Data is accessed where it lives so there is no need for duplication. A user can view all the information associated with a map object, regardless of where the data is stored (MapInfo tables, SQL Server, Oracle, Access, etc). MapInfo Exponare can also link to third party applications, such as property and rating systems, to provide a seamless interface to all relevant information within an organisation. MapInfo Exponare provides a map-based portal into an organisation’s data, both spatial and non-spatial. Data is accessed where it lives so there is no need for duplication. A user can view all the information associated with a map object, regardless of where the data is stored (MapInfo tables, SQL Server, Oracle, Access, etc). MapInfo Exponare can also link to third party applications, such as property and rating systems, to provide a seamless interface to all relevant information within an organisation.
|
Powerful capabilities
 MapInfo Exponare provides a range of capabilities out of the box such as template printing, thematics, queries (including spatial queries), mail merge, redlining, favourites, named views, application level linking, editing of attribute data and a range of mapping tools (zooming, selections, measuring distances, etc). The administrator can give users as much or as little functionality as required, based on their login. MapInfo Exponare provides a range of capabilities out of the box such as template printing, thematics, queries (including spatial queries), mail merge, redlining, favourites, named views, application level linking, editing of attribute data and a range of mapping tools (zooming, selections, measuring distances, etc). The administrator can give users as much or as little functionality as required, based on their login.
|
Part of an integrated suite
 MapInfo Exponare is part of the MapInfo suite of location intelligence products, making your data more powerful than ever. Data created in MapInfo® Pro can be published to MapInfo Exponare for internal or external use. Metadata catalogues created with MapInfo Manager can be searched on from MapInfo Exponare to help users to find the data they’re looking for and view metadata about that data to determine if it’s fit for purpose. MapInfo Exponare is part of the MapInfo suite of location intelligence products, making your data more powerful than ever. Data created in MapInfo® Pro can be published to MapInfo Exponare for internal or external use. Metadata catalogues created with MapInfo Manager can be searched on from MapInfo Exponare to help users to find the data they’re looking for and view metadata about that data to determine if it’s fit for purpose.
|
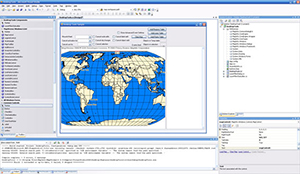
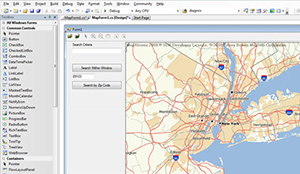
MapXtreme® for .Net
Software development toolkit for .Net developers embedding GIS in business applications.
MapInfo MapXtreme for .Net is a GIS software development kit for Microsoft .Net, providing support for embedding mapping and GIS capability into business applications. With it, developers can build custom mapping and spatially enabled applications.
MapXtreme’s powerful spatial capabilities are geared toward solving real business problems, with a powerful, user-friendly feature set. Flexible deployment options of this location intelligence developer tool include both desktop and web from a single SDK.
Rich GIS functionality
- Embed map visualisation and analysis in business applications
- Multiple ready to use map tools including pan, zoom, centre map, selections and more
- Manage data using Read/Write Feature data access using MI SQL (SQL 92 MM)
- Deliver geometry processing and measurements
- Manipulate and analyse raster and grid data including reprojection, interpolations, inflection points and hill shade support
- Consume interoperable OGC WMS & WFS services using MapXtreme for .Net OGC clients
- Ready-to-use controls including map, layer, legend, table info and more
|
Strong Microsoft .Net alignment
- 100% .Net Object Model
- Support for WinForms and WPF integration
- Visual GIS functionality available as ready-to-use Windows Controls
- Support for spatial data access in familiar ADO.Net
|
Rapid .Net development
- Full integration with Visual Studio.NET development environment
- Visual development with design time support enabling rapid application development
- Pre-defined map templates and sample applications to facilitate rapid application development
- Use any .NET language of choice making efficient use of your organization’s IT skills
- Full documentation and sample code for C# and VB.Net
|
Single SDK for desktop and server
- Consistent desktop and server web development experience
- Common engine for desktop and server editions
- Single SDK product for the development of both web and desktop applications
- Efficient sharing and re-use of code and knowledge between deployment types
|
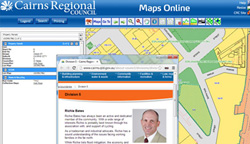
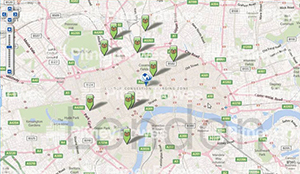
MapInfo Stratus
Instantly share location data via powerful interactive maps online.
MapInfo Stratus provides an efficient way to publish and share location data and geospatial assets through interactive, robust maps online, so you can enhance information sharing and collaboration across the enterprise internally or externally.
Putting the power of GIS in the hands of business users is easier than ever with MapInfo Stratus. Publish and share powerful, interactive maps via the web to enhance collaboration and informed decision making. Location data and information-rich maps can be presented, shared and viewed by multiple users in the cloud, providing real time access to critical insights—with no GIS experience required.
Operational Agility and efficiency
 Well-designed maps provide the foundation for better internal analyses, evaluation, communication and data-driven decision making. With Stratus, GIS expertise is not required. Spatial-data users across your organisation can access high-quality, interactive maps to gain the insights they need – whenever and wherever they need them. Well-designed maps provide the foundation for better internal analyses, evaluation, communication and data-driven decision making. With Stratus, GIS expertise is not required. Spatial-data users across your organisation can access high-quality, interactive maps to gain the insights they need – whenever and wherever they need them.
|
Combine and overlay data sets on-the-fly
 A simple, interactive web interface enables users to select different types of information to view together or separately. You can create translucent regions on maps while continuing to view points, lines and areas, as well as view and overlay other data and base maps, such as aerial photography or street data. A simple, interactive web interface enables users to select different types of information to view together or separately. You can create translucent regions on maps while continuing to view points, lines and areas, as well as view and overlay other data and base maps, such as aerial photography or street data.
|
24/7 self-service
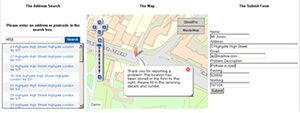 MapInfo Stratus lets you efficiently communicate spatial information to citizens, customers and constituents, online, 24/7. By integrating MapInfo Stratus with your own website, you can provide visitors with direct access to the information they need– easing the pressure on call centres at peak times and maximizing your resources. MapInfo Stratus lets you efficiently communicate spatial information to citizens, customers and constituents, online, 24/7. By integrating MapInfo Stratus with your own website, you can provide visitors with direct access to the information they need– easing the pressure on call centres at peak times and maximizing your resources.
|
Easy to deploy and use
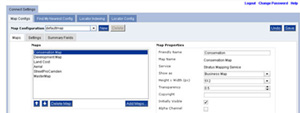 MapInfo Stratus features an intuitive, browser-based user interface, so it’s simple to administrate and use. It delivers the tools to enable GIS power users to create a workspace and publish directly from MapInfo® Pro to the MapInfo Stratus Administration Console, where you can define various parameters of your maps’ look and feel. MapInfo Stratus features an intuitive, browser-based user interface, so it’s simple to administrate and use. It delivers the tools to enable GIS power users to create a workspace and publish directly from MapInfo® Pro to the MapInfo Stratus Administration Console, where you can define various parameters of your maps’ look and feel.
|
MapMarker®
Geocode automatically and interactively, in real-time and batch.
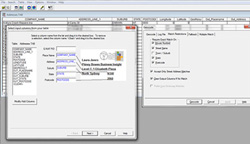
MapMarker corrects, standardises, and geocodes address information in one step. By combining postal and spatial addresses from the world’s leading data providers, MapMarker generates the most comprehensive set of address-level XY geocodes available, and improves overall data quality in the process.
MapMarker provides an easy-to-use interface for geocoding addresses in the US, Canada and Australia. Its underlying address dictionaries are built using CASS (for USA) and NAMF (for AUS) certifications, and the matching logic used for parsing has been developed and improved with each version for over a decade.
Built-in data quality
 MapMarker corrects, standardizes, and geocodes address information, all in one step. By combining postal data with your choice of spatial data files from the world’s leading data providers, it generates the most comprehensive set of address-level geocodes available and improves your overall data quality in the process. MapMarker corrects, standardizes, and geocodes address information, all in one step. By combining postal data with your choice of spatial data files from the world’s leading data providers, it generates the most comprehensive set of address-level geocodes available and improves your overall data quality in the process.
|
Cascading match logic for greater accuracy
 Other geocoding solutions draw from a single database. MapMarker can combine the data from disparate data sources, including spatial data from TomTom, NAVTEQ®, Centrus Points, TomTom Points, NAVTEQ Point Addresses and your own street or parcel data. This cascading process means more matches, fewer false positives, and faster CASS-certifiable results. Other geocoding solutions draw from a single database. MapMarker can combine the data from disparate data sources, including spatial data from TomTom, NAVTEQ®, Centrus Points, TomTom Points, NAVTEQ Point Addresses and your own street or parcel data. This cascading process means more matches, fewer false positives, and faster CASS-certifiable results.
|
Greater point-level precision
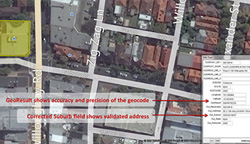 Cascading match logic enables MapMarker to geocode at the highest level of precision. It starts at point level, proceeding until it returns the most accurate latitude and longitude assignment available. In every case, it indicates the accuracy level utilized, showing the confidence you can place in the result. Cascading match logic enables MapMarker to geocode at the highest level of precision. It starts at point level, proceeding until it returns the most accurate latitude and longitude assignment available. In every case, it indicates the accuracy level utilized, showing the confidence you can place in the result.
|
MapMarker offers extraordinary:
- Speed: Process up to 1.4 million records per hour in batch mode.
- Flexibility: Perform real-time and batch processing. Integrate easily with key applications and popular relational database management systems.
- Control: Specify matching criteria and data elements returned through an easy-to-use interactive API.
- Accuracy: Cascading match logic yields the best available results.
- Options: Use MapMarker to geocode at the levels that fit your needs:
- Street or parcel-centroid
- Postal code Centroid
- Municipal / city / town centroid, street centroid, county centroid
- Intersections
- Custom user dictionary, for matching to your own street or parcel data
|
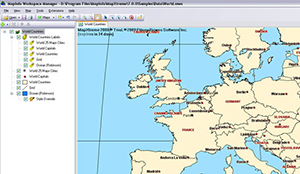
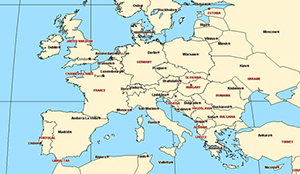
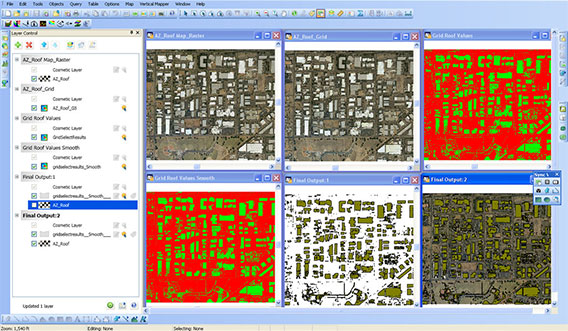
MapInfo Vertical Mapper
Gain deeper location insight using grid-based analytics.
MapInfo Vertical Mapper is a spatial data analysis tool that lets you display, manage and interpret grid-based continuous spatial information. Gain an upper hand by turning geospatial data into compelling information and actionable insight.
MapInfo Vertical Mapper complements MapInfo® Pro and adds advanced analytical tools with a comprehensive set of raster grid creation, visualization and analysis capabilities. Using continuous surface grid-based data significantly boosts MapInfo® Pro’s power and flexibility in a wide variety of analytical tasks
Break free from boundaries
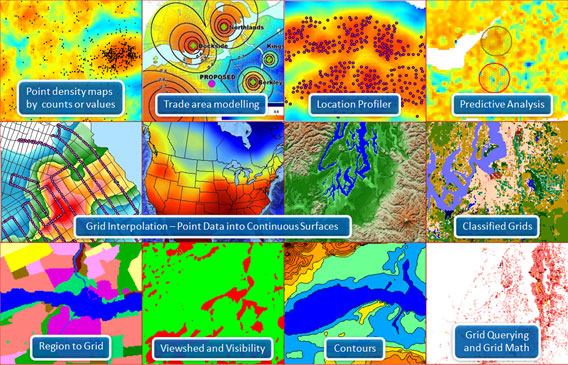 MapInfo Vertical Mapper has a wide range of advanced analytical and visualization tools that allow you to reveal important trends and hidden nuances about your data. Grid-based raster analysis does not rely on aggregation of data into existing boundaries, which are often designed for specific administrative or political purposes and may not be well suited to data analysis. MapInfo Vertical Mapper has a wide range of advanced analytical and visualization tools that allow you to reveal important trends and hidden nuances about your data. Grid-based raster analysis does not rely on aggregation of data into existing boundaries, which are often designed for specific administrative or political purposes and may not be well suited to data analysis.
Powerful prediction capabilities are another unique feature of MapInfo Vertical Mapper. Specify a test location and MapInfo Vertical Mapper will identify areas with statistically similar attributes. This means complex tasks such as analysing demographic and geographic variables used to locate a new retail outlet are reduced to a few mouse clicks.
|
Seamlessly create sophisticated grids
 Creating grids (a continuous surface representation of your data) is easy with MapInfo Vertical Mapper. The software includes a full suite of standard methods to extract and build grids from your data. Easy-to-use wizards help novice users achieve meaningful answers while experienced mappers can adjust advanced settings to obtain more sophisticated results. Creating grids (a continuous surface representation of your data) is easy with MapInfo Vertical Mapper. The software includes a full suite of standard methods to extract and build grids from your data. Easy-to-use wizards help novice users achieve meaningful answers while experienced mappers can adjust advanced settings to obtain more sophisticated results.
|
Display grids
 MapInfo Vertical Mapper grid colour settings define data variations and dynamic 3D rendering tools let you bring data to life. View multiple grids within the same scene, apply drapes to any open grid, and determine the degree of transparency for both grids and drape files. Count on MapInfo Vertical Mapper to give you a wealth of display options and visualization capabilities to generate impressive and intelligent data representations. MapInfo Vertical Mapper grid colour settings define data variations and dynamic 3D rendering tools let you bring data to life. View multiple grids within the same scene, apply drapes to any open grid, and determine the degree of transparency for both grids and drape files. Count on MapInfo Vertical Mapper to give you a wealth of display options and visualization capabilities to generate impressive and intelligent data representations.
|
Analyse grids
 Enter a whole new world of cutting-edge geographic analysis made possible through MapInfo Vertical Mapper grid technology. Whether you need to query and compare multiple layers of information, use mathematical expressions to derive new information from your existing grids, or simply perform terrain related analysis, MapInfo Vertical Mapper provides robust spatial analysis capabilities that help you gain invaluable insight from your data. Enter a whole new world of cutting-edge geographic analysis made possible through MapInfo Vertical Mapper grid technology. Whether you need to query and compare multiple layers of information, use mathematical expressions to derive new information from your existing grids, or simply perform terrain related analysis, MapInfo Vertical Mapper provides robust spatial analysis capabilities that help you gain invaluable insight from your data.
|
Spectrum Location Intelligence Module
Enable location-intelligent decision making.
Gain highly accurate location-based insights designed to fuel better business performance. Benefit from powerful address geocoding and efficient enterprise routing. Reduce risk and improve both operations and customer satisfaction.
Combine business and geospatial information to gain a true view of your business and customers, while solving the most complex business problems. Verify locations and transform location insights into valuable business intelligence to reduce risk, increase customer satisfaction and streamline operations.
Interactive mapping and spatial analysis
 Rapidly create interactive mapping and spatial analysis web sites using rich internet application (RIA) user interface components and web services (SOAP, REST, OGC). Deliver powerful applications with support for mapping for visualization and analysis, comprehensive spatial query and geometry calculations. Create applications for public internet, partner and corporate intranet web sites. Rapidly create interactive mapping and spatial analysis web sites using rich internet application (RIA) user interface components and web services (SOAP, REST, OGC). Deliver powerful applications with support for mapping for visualization and analysis, comprehensive spatial query and geometry calculations. Create applications for public internet, partner and corporate intranet web sites.
|
Analytical mapping visualisation
 Use the extensive range of analytical mapping visualisation in Spectrum to successfully communicate a clear common operational picture. Integrate mapping and spatial analysis into business systems such as Business Intelligence (BI), Enterprise Intelligence (EI), Customer Relationship Management (CRM), Enterprise Resource Planning (ERP) and supervisory control and data acquisition (SCADA) to improve decision making. Use the extensive range of analytical mapping visualisation in Spectrum to successfully communicate a clear common operational picture. Integrate mapping and spatial analysis into business systems such as Business Intelligence (BI), Enterprise Intelligence (EI), Customer Relationship Management (CRM), Enterprise Resource Planning (ERP) and supervisory control and data acquisition (SCADA) to improve decision making.
Spectrum Spatial Location Intelligence Module allows you to increase efficiency through spatially enabling business analysts existing working environment and reducing the reliance on scarce GIS analyst resources.
|
Operational Location Intelligence
 Use Operational Location Intelligence to deliver efficiency improvements and apply spatial intelligence directly within human free straight through processes and automated business decisioning. Operational Location Intelligence enables spatial business rules and logic to be embedded within operational systems and frees the organisation from costly overheads of manual spatial analysis processes in workflows. By reducing manual analysis workloads to exception handling only business rules are applied more consistently and faster decisions can be made in support of real time responses. Use Operational Location Intelligence to deliver efficiency improvements and apply spatial intelligence directly within human free straight through processes and automated business decisioning. Operational Location Intelligence enables spatial business rules and logic to be embedded within operational systems and frees the organisation from costly overheads of manual spatial analysis processes in workflows. By reducing manual analysis workloads to exception handling only business rules are applied more consistently and faster decisions can be made in support of real time responses.
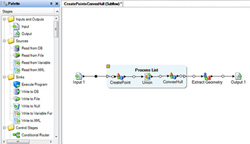
The Location Intelligence module provides support for visual point-click design of data flows for operational location intelligence decreasing the time to value and increasing the flexibility to rapidly adapt the logic and rules to changes in business.
|
Integrate business data with GIS data
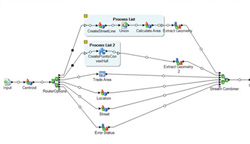 Bring business data and GIS data together using built in spatially enabled visual data integration enabling organisations to rapidly expose the value of hidden location with their data assets. Integrate data in GIS formats and spatial databases with business data in XML, files, web services and RDBMS removing domain data silos and simplifying the spatially enabled IT organisation. Transform business data from multiple systems to build spatial databases. Create data flows for batch and web service based transactional data integration. Bring business data and GIS data together using built in spatially enabled visual data integration enabling organisations to rapidly expose the value of hidden location with their data assets. Integrate data in GIS formats and spatial databases with business data in XML, files, web services and RDBMS removing domain data silos and simplifying the spatially enabled IT organisation. Transform business data from multiple systems to build spatial databases. Create data flows for batch and web service based transactional data integration.
Use spatial data integration to augment business databases with spatially derived data values extending the value of spatial intelligence to more difficult to access systems.
Build geospatial application databases supporting interactive mapping and spatial analysis applications for web and desktop clients.
|
Interoperability
Share maps and data through certified Open Geospatial Consortium (OGC) Services for web mapping (WMS), feature (WFS) and cataloguing (CSW). Reuse the same data and maps via SOAP and REST interfaces to support integration with other IT systems and middleware enabling both IT and GIS trained resources to access spatial capability.
|
Part of the Spectrum Platform
The Location Intelligence Module is part of the Spectrum platform. As such it can be used with any of the modules in the platform and shares a common management and flow design environment simplifying administration.
The Location intelligence module is part of the Spectrum Platform Spatial Solution encompassing the Location Intelligence Module, Enterprise Routing Module, Enterprise Geocoding Module and GeoTex Module. In addition to spatial capability a broad range of business data quality and management capability is available.
|